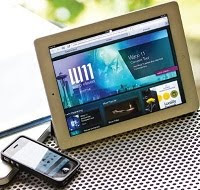
La plataforma más utilizada es Android seguida por Apple y RIM (blackberry).
La ciudad de mayor crecimiento en tráfico de web móvil? Zimbabwe seguida de Nigeria e India. El continente africano se perfila como el de mayor crecimiento en esta área. Google domina el mercado de los buscadores seguido por Bing y Yahoo.
Te interesan más datos? mira las últimas estadísticas de tránsito online de móviles, incluyendo acciones de motores de búsqueda, las ventas estadounidenses M-commerce, el tráfico móvil y mucho más.
| Mobile share of Web Traffic all across the World | ||
| Region | 2010 | 2012 |
| Africa | 5.81% | 14.85% |
| Asia | 6.1% | 17.84% |
| Europe | 1.81% | 5.13% |
| North America | 4.71% | 7.96% |
| South America | 2.88% | 7.55% |
| Oceania | 1.46% | 2.86% |
| World Wide | 3.81% | 10.01% |
| Top 10 Countries with Highest Mobile Web Share Traffic | ||
| Country | Mobile Share of Web Traffic | |
| Zimbabwe | 58.06% | |
| Nigeria | 57.89% | |
| India | 48.24% | |
| Sudan | 45.32% | |
| Zambia | 44.24% | |
| Uzbekistan | 42.77% | |
| Laos | 35.66% | |
| Malawi | 35.48% | |
| Brunei | 34.05% | |
| Libya | 27.68% | |
| 46% of US Population own Smartphone of Some Kind | ||
| Nearly 7% of US Digital Traffic connects from Non-computer Devices Non-Computer Traffic Share by Devices | ||
| Devices | Traffic Share | |
| Mobiles/Smart phones | 64.4% | |
| Tablets | 28.1% | |
| Others | 7.5% | |
| Top Smartphone Platform by Market Share | ||
| Smartphone platform | Market Share | |
| Android | 50.1% | |
| Apple | 30.2% | |
| RIM | 13.4% | |
| Microsoft | 3.9% | |
| Symbian | 1.5% | |
| Mobile Search Engine Share | ||
| Search Engine | Market Share | |
| 91.7% | ||
| Bing and Yahoo | 6.2% | |
| Others | 2.1% | |
| US M-commerce sales accounts for 3% ecommerce sales in 2012 and will reach 7% by 2016 | ||
| Year | US M-commerce Sales (in Billions) | |
| 2012 | 10 | |
| 2013 | 14 | |
| 2014 | 19 | |
| 2015 | 25 | |
| 2016 | 31 | |
| Mobile Traffic to the Top 500 E-Retailers | ||
| Year | %age of Visits | |
| 2011 | 13.4% | |
| 2012 | 24.6% | |
| 2013 | 39.0% | |
| 2014 | 53.2% | |
| 2015 | 60.6% | |
| Top Reasons why consumer prefer M-commerce | ||
| Top Reasons | %age | |
| On The Go Convenience | 63% | |
| Special Discounts/Coupons | 52% | |
| Easy to compare prices | 48% | |
| Product not available in-store | 41% | |
| Mobile Shopping Activities of Smartphone Owners | ||
| Shopping Activities | %age | |
| Take Product Picture | 37% | |
| Locate Nearby Store | 32% | |
| Search for Coupons | 31% | |
| Research Products or Prices | 30% | |
| Research Products or Prices at specific store | 28% | |
| Send Product Pictures to Friends | 27% | |
| Scan Bar Code | 26% | |
| Read Customer Reviews | 24% | |
| Check Store Inventory | 18% | |
| Top Mobile commerce purchase categories | ||
| Purchase Category | %age of Audience | |
| Digital Goods | 47% | |
| Clothing | 37% | |
| Tickets | 35% | |
| Daily Deals/ Discount coupons | 34% | |
| Gift Certificates | 34% | |
| Electronics | 32% | |
| Physical Books | 26% | |
| Airplane Tickets | 24% | |
| Flowers | 21% | |
Síguenos en
Twitter: @amddominicana
Facebook http://www.facebook.com/amddominicana
Suscríbete a nuestro canal en youtube: Amdrd Dominicana


No hay comentarios:
Publicar un comentario